
In this article, we aim to examine the Volatility Index and its Indian counterpart, India VIX and its working. Our journey will encompass understanding their origins, methodologies, implications, and the correlation they share with market movements.
Understanding the VIX:
The term VIX stands for Volatility Index, a numeric representation of anticipated market volatility over the next 30 days. It serves as a gauge for market participants, helping them assess sentiments, risk levels, and apprehension, which is why it’s often dubbed the “Fear Index.”
The VIX is determined using bid-ask quotes from option contracts associated with the market index, expressed as a percentage.
The CBOE VIX:
Our journey begins in 1993 when the Chicago Board Options Exchange (CBOE) introduced the CBOE VIX. This index monitors options contracts of the S&P 500 Index for the forthcoming 30 days, offering a pioneering insight into market volatility.
Introducing India VIX:

The National Stock Exchange (NSE) of India stepped into the fray in 2008 with its own iteration, the ‘India Volatility Index.’ Tailored to reflect the expected volatility of the Nifty index over the next 30 days, India VIX serves as a sentiment barometer.
Interpreting India VIX:
Understanding India VIX is important . When this index goes up, it signals escalating market volatility, often accompanied by heightened apprehension. Conversely, when India VIX goes down it suggests subsiding volatility and increased market stability.
Defying the Norm:
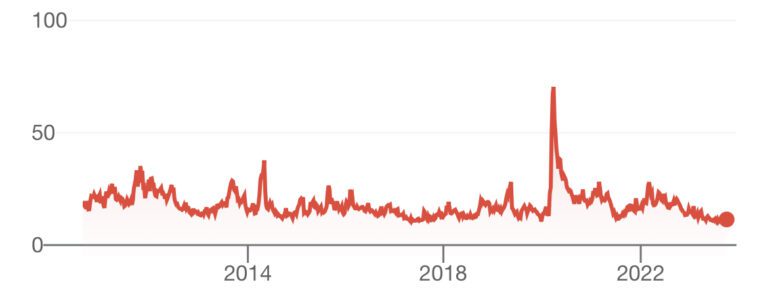
Typically oscillating between 11% and 25%, India VIX occasionally breaches these confines. The pandemic outbreak in 2020 provides a vivid example, with the index skyrocketing to an astonishing 70, reflecting extreme market turmoil.
Cracking the Calculation Code:
The methodology underpinning VIX computation employs the Black & Scholes (B&S) Model. This model factors in strike price, market stock price, time to expiry, risk-free rate, and volatility.
Let’s unravel the role of each component:
- Time to Expiry: Precision demands calculation in minutes rather than days.
- Interest Rate: A relevant rate spanning 30 to 90 days guides the risk-free interest rate.
- Forward Index Level: It dictates the at-the-money strike, a pivotal factor in selecting the right options contract.
- Bid-Ask Spread: For VIX computation, the best bid and ask prices for out-of-the-money options are employed.
Deciphering the Correlation:
India VIX’s unique trait lies in its ability to forecast the expected annual change in the NIFTY50 index over 30 days. In essence, it predicts potential market fluctuations.
A low India VIX denotes market participants’ confidence, signifying anticipation of stability and minimal volatility. Conversely, a high India VIX signals uncertainty, elevated volatility, and the potential for significant market shifts.
Connecting the Dots:
The correlation between India VIX and Nifty is worth highlighting. When India VIX rises, Nifty tends to decline, and vice versa. While India VIX doesn’t predict market direction, historical evidence suggests a negative correlation between the two.

In Conclusion:
In this analytical journey, we’ve understood VIX and India VIX, dissected their intricate components, and illuminated the correlation they share with Nifty.
Remember, India VIX serves as a valuable lens into market volatility, aiding traders in shaping their strategies. While short-term volatility might not significantly sway long-term investments, monitoring the broader volatility landscape remains a prudent practice.
In the dynamic realm of finance, knowledge is the ultimate asset. Embrace the insights offered by India VIX, and let them guide you through the ever-evolving world of market fluctuations.